
First thing first, we need to download data from Yahoo Finance
# import libraries
import yfinance as yf
import pandas as pd
import datetime

# Download all stock price historical data from yahoo finance
spy_data = yf.download("SPY")
aapl_data = yf.download("AAPL")
goog_data = yf.download("GOOG")
tsla_data = yf.download("TSLA")
amzn_data = yf.download("AMZN")
meta_data = yf.download("META")
nvda_data = yf.download("NVDA")

# Reset index to turn date to a separate column
spy_data.reset_index(inplace=True)
aapl_data.reset_index(inplace=True)
goog_data.reset_index(inplace=True)
tsla_data.reset_index(inplace=True)
amzn_data.reset_index(inplace=True)
meta_data.reset_index(inplace=True)
nvda_data.reset_index(inplace=True)

# Add a column for ticker symbol
spy_data['Ticker']  = 'SPY'
aapl_data['Ticker'] = 'AAPL'
goog_data['Ticker'] = 'GOOG'
tsla_data['Ticker'] = 'TSLA'
amzn_data['Ticker'] = 'AMZN'
meta_data['Ticker'] = 'META'
nvda_data['Ticker'] = 'NVDA'

# Put all stocks into a consolidated data frame
stock_all = pd.concat([spy_data, aapl_data, goog_data, tsla_data, amzn_data, meta_data, nvda_data])

# Restrict data to work with to only dates after specific year
stock_all['Date'] = pd.to_datetime(stock_all['Date'])
df = stock_all[stock_all['Date'] >= '2023-01-01']

# preview data structure
df.info()
First, let’s import libraries
from bokeh.layouts import layout, column, row
from bokeh.models import ColumnDataSource, RangeSlider, DateRangeSlider, HoverTool, CDSView, BooleanFilter, CustomJS, Dropdown, Select, Div
from bokeh.plotting import figure, output_notebook, show
from bokeh.io import output_notebook, show
output_notebook()
1. Create candle stick chart with Toolbox
# Create Candle Stick Chart for one ticker
ticker = 'TSLA'
df_in_use = df[df['Ticker'] == ticker]

# Create candle chart
increase_logic = df_in_use['Close'] > df_in_use['Open']
decrease_logic = df_in_use['Open'] > df_in_use['Close']

# Width is 1 day
w = 24*60*60*1000 # 1 day in ms

TOOLS = "pan,wheel_zoom,box_zoom,reset,save"

p = figure(x_axis_type="datetime", tools=TOOLS, width=1000, title = f'Candlestick {ticker}', sizing_mode = "stretch_width")

p.grid.grid_line_alpha=0.3

p.segment(x0 = df_in_use['Date'], y0 = df_in_use['High'], x1 = df_in_use['Date'], y1 = df_in_use['Low'], color="black")

p.vbar(x = df_in_use['Date'][increase_logic],
       top = df_in_use['Open'][increase_logic],
       bottom = df_in_use['Close'][increase_logic],
       width = w, fill_color="green", line_color ="green")

p.vbar(x = df_in_use['Date'][decrease_logic],
       top = df_in_use['Open'][decrease_logic],
       bottom = df_in_use['Close'][decrease_logic],
       width = w, fill_color="red", line_color="red")

show(p)
Candlestick chart for TSLA shows up as expected
Now the chart has 2 extra interactive features:
Timeline can be adjusted using Time Slider at the bottom
Different stock ticker can be selected from the dropdown list in the upper left corner
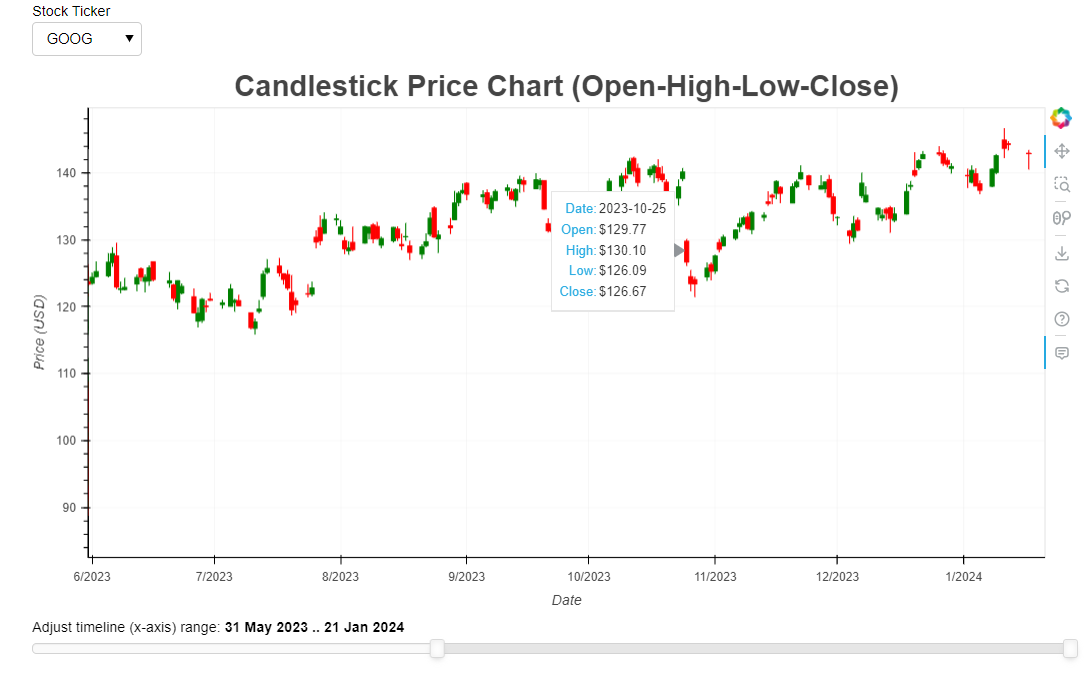
Here we can see that the chart automatically updates when I choose GOOG instead of TSLA in the Stock Ticker dropdown list
Timeline range is narrowed to June 2023 - Jan 2024
When hovering the mouse over the specific candlestick, specific details of stock price on that specific date are shwon

2. Create Interactive Candle Stick Charts with Dropdown Selection
# Define date range for graph
start_date = pd.to_datetime('2023-01-01')
end_date   = datetime.datetime.now()
date_rangeX = pd.date_range(start = start_date, end = end_date)

# Create lists for ticker
ticker_list = ['SPY', 'AAPL', 'AMZN', 'GOOG', 'META', 'NVDA', 'TSLA']

# Start with one ticker
ticker = 'TSLA'
df_in_use = df[df['Ticker'] == ticker]
df_in_use_green = df_in_use[df_in_use['Close'] >= df_in_use['Open']]
df_in_use_red = df_in_use[df_in_use['Close'] < df_in_use['Open']]

# Create a ColumnDataSource containing only the current ticker
#source = ColumnDataSource(df_in_use)
source_green = ColumnDataSource(df_in_use_green)
source_red = ColumnDataSource(df_in_use_red)

# Create a ColumnDataSource containing all data for filtering
source_all = ColumnDataSource(df)

# Width is 1 day
w = 24*60*60*1000 # 1 day in ms

# Create candlelight chart for df_in_use
graph = figure(x_axis_type  = "datetime",
               title        = "Candlestick Price Chart (Open-High-Low-Close)",
               x_axis_label = 'Date',
               y_axis_label = 'Price (USD)',
               sizing_mode  = "stretch_width",
               height = 500)

# Make grid line more transparent
graph.grid.grid_line_alpha=0.3

# Add segment and vertical bars for each data row
graph.segment(source=source_green, x0 ='Date', y0='High', x1='Date', y1='Low', color="green")
graph.segment(source=source_red, x0 ='Date', y0='High', x1='Date', y1='Low', color="red")

graph.vbar(source=source_green,
           x = 'Date',
           top = 'Open',
           bottom = 'Close',
           width = w, fill_color="green", line_color ="green")

graph.vbar(source=source_red,
           x = 'Date',
           top = 'Open',
           bottom = 'Close',
           width = w, fill_color="red", line_color="red")

# Make font size of title bigger
graph.title.text_font_size = '20pt'
graph.title.align = "center"

# Set up RangeSlider for timeline
timeline_slider = DateRangeSlider(  title = "Adjust timeline (x-axis) range",
                                    start = date_rangeX.min(),
                                    end   = date_rangeX.max(),
                                    step  = 1,
                                    value = (date_rangeX.min(), date_rangeX.max()),
                                    sizing_mode = "stretch_width")

# Add callback code
timeline_slider.js_link("value", graph.x_range, "start", attr_selector=0)
timeline_slider.js_link("value", graph.x_range, "end", attr_selector=1)

# Define Hover Tool
hover_tool = HoverTool( tooltips=[   #('Ticker', '@Ticker'),
                                     ('Date',   '@Date{%F}'),
                                     ('Open',  '@Open{$0.00}'),
                                     ('High',  '@High{$0.00}'),
                                     ('Low',   '@Low{$0.00}'),
                                     ('Close', '@Close{$0.00}') ],
                        formatters = {'@Date': 'datetime',    }    )

# Add hover_tool to graph
graph.add_tools(hover_tool)

# Create single Selection widget
select = Select(title = 'Stock Ticker',
                value = 'TSLA',
                options = ticker_list,
                width = 100,
                #margin = (5, 5, 5, 80)
               )

# Create a callback function to kick through changes when a new ticker is chosen
callback = CustomJS(
    args = dict(source_green = source_green, source_red = source_red, source_all = source_all, select = select),
    code ="""
        // get the value from the dropdown
        var ticker_name = select.value;

        // filter the full data set to include only those from that ticker
        var data_all = source_all.data;
        var data_green = source_green.data;
        var data_red = source_red.data;

        data_green['Date'] = [];
        data_green['Open'] = [];
        data_green['High'] = [];
        data_green['Low'] = [];
        data_green['Close'] = [];

        data_red['Date'] = [];
        data_red['Open'] = [];
        data_red['High'] = [];
        data_red['Low'] = [];
        data_red['Close'] = [];

        for (var i = 0; i < data_all['Ticker'].length; i++) {
            if (data_all['Ticker'][i] == ticker_name) {
                if (data_all['Close'][i] >= data_all['Open'][i]) {
                    data_green['Date'].push(data_all['Date'][i]);
                    data_green['Open'].push(data_all['Open'][i]);
                    data_green['High'].push(data_all['High'][i]);
                    data_green['Low'].push(data_all['Low'][i]);
                    data_green['Close'].push(data_all['Close'][i]);
                } else {
                    data_red['Date'].push(data_all['Date'][i]);
                    data_red['Open'].push(data_all['Open'][i]);
                    data_red['High'].push(data_all['High'][i]);
                    data_red['Low'].push(data_all['Low'][i]);
                    data_red['Close'].push(data_all['Close'][i]);
                }
            }
        }

        // commit changes
        source_green.change.emit();
        source_red.change.emit();
    """)

# Call function on change of selection in drop down list
select.js_on_change("value", callback)

# Create a separate callback to update the Hover Tool
hover_callback = CustomJS(
    args=dict(hover_tool=hover_tool, select=select),
    code="""
        // get the value from the dropdown
        var ticker_name = select.value;

        // Update the ticker name in the Hover Tool
        hover_tool.tooltips[0][1] = ticker_name;
        hover_tool.update();
    """
)

# Attach the hover_callback to the graph
graph.js_on_change("renderers", hover_callback)

# create layout
layout = column([select,  graph,   timeline_slider],
                sizing_mode = 'stretch_width')

# show result
show(layout)

Notebook in my github repository:
https://github.com/ExcellentBee/Learning-Everyday/blob/main/Candlestick%20Stock%20Chart%20Using%20Bokeh.ipynb