
analyze and predict ar late payment
In today’s corporate finance function, managing accounts receivable (AR) efficiently is more crucial than ever. Predictive analytics is revolutionizing how companies handle their invoicing and payments, turning traditional methods on their head. This blog post attempts to use advanced analytics and machine learning models to forecast potential late invoice payments. By predicting when invoices will be paid, businesses can optimize their financial strategies, take proactive actions to reduce the risk of bad debt, and improve their overall financial health.
The dataset used in this project is from Kaggle:
https://www.kaggle.com/datasets/hhenry/finance-factoring-ibm-late-payment-histories/data
Link to Jupiter Notebook on GitHub repository:
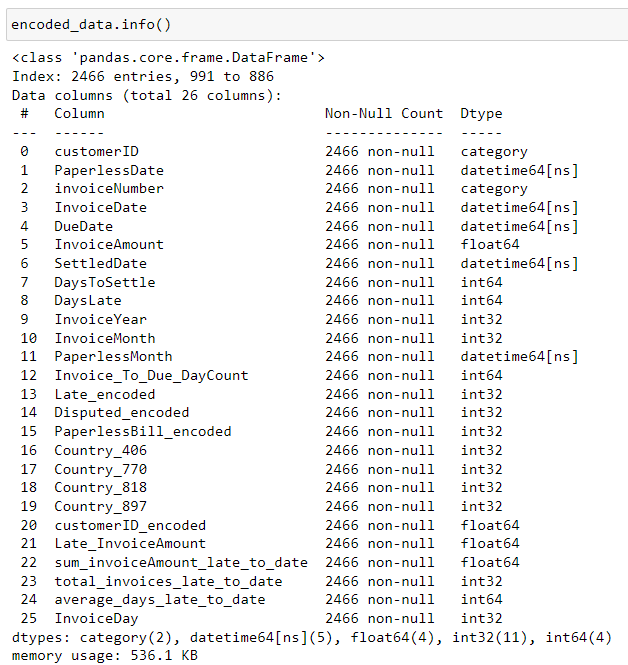
ETL (Extract, transform, load)
First, load the data and get an initial read into dataset structure


Observations:
Orginal data set has 11 columns and 2466 rows. Although initial reading doesn't show any Null values in any column, we need to examine each column more carefully later to see if there are unexpected and illogical values that should actually be transformed into NULL
The 11 columns can be broken down into 3 categories:
(1) Indentifier columns:
invoiceNumber is the main ID column in this dataset as each row is a different invoice. We can ignore statistical data as we are not doing any calculation with this field. invoiceNumber column contains only unique values which is as expected (and indicate that this dataset has been somewhat cleaned and validated)
countryCode is used to identify country/location, thus even though its datatype is integer, we should treat them as ID and ignore statistical data as we are not doing any calculation
customerID is another ID column where we could do analysis at aggregation level to compare AR pattern. It's reasonable to expect that invoices belonging to the same customerID will have some sort of similar pattern at around the same time as the financial conditions impacting specific clients likely impact all invoices belonging to that client in similar way
(2) Categorical columns:
Disputed is a Boolean field with 2 values: Yes and No
PaperlessBill is a Boolean field with 2 values: Paper and Electronic
(3) Nuremical columns:
InvoiceAmount: dollar amount for each invoice, a variance of special interest
DaysToSettle: seem to be a calculated field to show the number of days between Invoice Date and Settled Date
DaysLate: seem to be a calculated field to show the number of days between DueDate and Settled Date, if the payment is not late then DaysLate = 0, otherwise, DaysLate > 0
(4) Date columns:
PaperlessDate: This is likely date that client switches from Paper to Electronic invoice, and thus each client should have 1 unique Paperless Date. We will test this hypothesis in the EDA section
InvoiceDate: important date column to understand invoicing activities
DueDate: important date column to understand if an invoice is late or on-time
SettledDate: important date column to understand if an invoice is late or on-time
Second, standardize datatype for each column and apply One Hot Encoding to categorical variables
2. EDA (Exploratory Data analysis)
2.1. SINGLE VARIABLE
1. Country Code

Observation: invoices are distributed pretty evenly between 5 different country codes, even the one with least number of invoices accounts for ~ 16% of total invoices. Thus, data is not skewed toward a specific country.
2. Customer ID

Observation: There are 100 unique customers, number of invoices associated with each customer ranges from 15 to 36

Observation: Number of invoices by customerID has a bell-shape right-skewed distribution, with mode << median < mean

Observation: Average Days Late has a highly right-skewed distribution, with the majority of clients paying on time and some outliers taking up to 20 days pass DueDate to pay
3. disputed

Observation: 22.7% of invoices are disputed vs 77.2% are not disputed

Observation: There are only 2 years of invoice data and the distribution is pretty much even between 2 years in terms of both invoice count and proportion of Disputed invoices

Observations: There are 3 groups of countryCodes when it comes to proportion of Disputed Invoices
CountryCode 391 has the lowest percentage of disputed invoices at 10% (of total invoices for that country).
CountryCode 770 and 897 have the second lowest percentages of disputed invoices at around 15%.
CountryCode 406 and 818 have the highest percentages of disputed invoices at around 38%.

Observation:
25% of clients have no disputed invoices (healthy collection activities)
42% of clients have less than 25% of their invoices categorized as "Disputed" (excludes clients with NO disputed invoices)
33% of clients have more than 25% of their invoices categorized as "Disputed"
4. paperless bill

Observation: There seems to be the same number of invoices that are paper vs electronic

Observation: We can see that from 2012 to 2023, there is a clear transition of invoices from paper to electronic

Observation: It doesn't seem like there are significant differences in proportion of "Paper" vs "Electronic" invoces by Country
Observation: From Jan 2012 to Jan 2024, these batches of invoices go from 100% paper to 100% electronic, which is a good thing to see
5. Paperless date

Observation: The transition from Paper to Eletronic invoices occurs gradually over time for different batches of clients
6. invoice date

Observation: Number of invoices and total invoice amount peak at different month in 2012 vs 2013 so there might not be strong seasonality factor here
7. DUE date

8. settled date

Observation:
Negative numbers are cases where Settled Date < Due Date, meaning that the invoice was paid off before Due Date and it is not a late payment
Positive numbers are cases where Settled Date > Due Date, meaning that the invoice was paid off AFTER Due Date and it IS indeed a late payment
The histogram has a right-skewed bell shaped
Both median and mean being around -4 means that on average, invoice is paid around 4 days before Due Date
9. Days to settled Date

Observation:
Histogram shows a well-balanced bell-shaped distribution with mean and median approximately equal
On average, invoices are paid after 26 days of Invoice Date
10. days late

Observation: The vast majority of invoices are not paid late. Distribution of DaysLate is heavily right-skewed


Let's use bootstrap to test if the mean of DaysLate for Disputed invoices is statistically significantly different from the mean of DaysLate for non-Disputed invoices
Null Hypothesis: H_0: mean_Disputed = mean_non_Disputed
Alternative Hypothesis: H_A: mean_Disputed ≠ mean_non_Disputed
We don't make any assumptions on the distributional nature of the data or the limiting distribution for the test-statistic
For a two-sided alternate hypothesis, we reject the null hypothesis if p-value < alpha/2 or p-value > 1-alpha/2
RESULT:
Observed difference in means: 6.649663845495249
Bootstrap p-value: 0.4983
Observation:
4958 out of the 10000 bootstrap replicates have mean_disputed > mean_non_disputed
Bootstrap p-value of almost 0.5 is much larger than the usually chosen alpha/2 = 0.025 (alpha = 0.05). Thus, we cannot reject the Null hypothesis. There is not sufficient evidence to reject that the 2 means are equal
Speaking in another way, the large delta we see between the means of DaysLate for Disputed vs Non-Disputed cases could be due to randomness

Observation:
Distribution of DaysLate across countryCode looks identical in shape
Country 391 has lowest Mean of DaysLate due to the vast majority of invoices being on-time and max of DaysLate of 24 being smaller than that statistic in any other countryCode


Let's use bootstrap to test if the mean of DaysLate for Paper invoices is statistically significantly different from the mean of DaysLate for Electronic invoices
Null Hypothesis: H_0: mean_Paper = mean_Electronic
Alternative Hypothesis: H_A: mean_Paper ≠ mean_Electronic
We don't make any assumptions on the distributional nature of the data or the limiting distribution for the test-statistic
For a two-sided alternate hypothesis, we reject the null hypothesis if p-value < alpha/2 or p-value > 1-alpha/2
RESULTS:
Observed difference in means: 2.0551136015859006
Bootstrap p-value: 0.4988
Observation:
4988 out of the 10000 bootstrap replicates have mean_paper > mean_electronic
Bootstrap p-value of almost 0.5 is much larger than the usually chosen alpha/2 = 0.025 (alpha = 0.05). Thus, we cannot reject the Null hypothesis. There is not sufficient evidence to reject that the 2 means are equal
Speaking in another way, the large delta we see between the means of DaysLate for Paper vs Electronic cases could be due to randomness
11. Invoice Amount

Observation: Invoice Amount looks like a well-balanced bell-shaped distribution with mean and median both hover around 60
2.2. VARIABLEs PAIRS
See the rest in GitHub Python workbook