
For those working in Business Analytics/FP&A function of SaaS firms, gaining a deep understanding of the intricated nuances of contract data and ASC606-compliant revenue components is crucial. Leveraging Python's powerful data manipulation and visualization capabilities, we can perform powerful and insightful Exploratory Data Analysis (EDA) to uncover patterns and outliers that are pivotal for forecasting and variance analysis. Critical insights can also be quickly published to dashboards for broader-audience consumption.
Link to Jupiter Notebook on Github:
https://github.com/ExcellentBee/Analyze-Visualize-SaaS-Revenue-data/blob/main/SaaS%20Top%20Line%20Analysis%20from%20Contract%20Data.ipynb
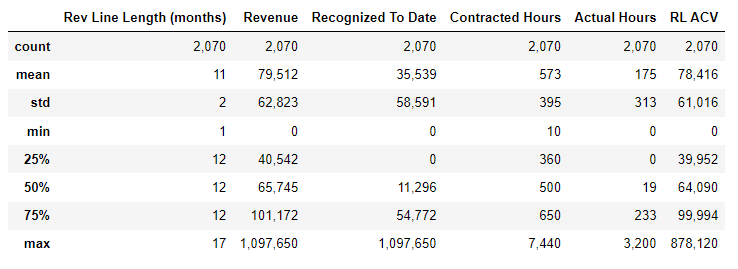
First step is to load in raw dataset and pull up multiple examples to understand how the revenue data is structured. Understanding the metadata and functions of each column allows us to do a better job of cleaning and standardizing data fields that are needed for next-step analyses.

Observation:
The dataset has details at Revenue Line level, each has its own start date, end date, revenue/contract value associated with it. This is probably the unit level of performance obligation as specified in contract that company needs to track delivery against in order to recognize revenue.
Unique ID for Revenue Lines is "RevPro ID"
The first level of roll-up is "Contract ID", which can contain 1 or multiple "RevPro ID"
The second level of roll-up is "Client ID", which can contain 1 or multiple "Contract ID"
For example, Client 1 has Contract SUB121444 that spans 3 years, each annual cycle has its own RevPro ID.
The first RevPro ID is for March 2019 - March 2020, 600 contracted hours for $65,830.
The second RevPro ID is for the second year of engagement March 2020 - March 2021, 400 contracted hours for $43,890.
The third RevPro ID is for the third year of engagement March 2021 - March 2022, 400 contracted hours for $43,890.
This contract has the exact same hourly revenue rate across 3 years (no price increase), just that the first year is allocated more hours and thus more CV
For 2 RevPro lines that had ended, Recognized To Date = Revenue despite Actual Hours << Contracted Hours, this confirms the practice of "use it or loose it", meaning that at the end of each RevPro line, the firm can book all un-accrued revenue as catch-up on the last day of each annual cycle.
Thus, we can do analysis and calculation at 3 levels of details: RevPro ID, Contract, Client
Revenue Line (RL) level analysis
Revenue Line Length and ACV Analysyis

Observations:
The overwhelming majority of RevPro ID lines are 1-year length with only a handlful of outliers of 1 months, 9 months, 16 months
Both Fixed Term and Opt Out contracts contain one or multimple RevPro ID lines that are normally 1-year long
The standard practice here is that for multi-year deals, revenue is broken down into multiple annual cycle, each with its own obligation (in terms of contracted hours) and associated revenue
This Accounting practice is pretty common, especially in the world of ASC606 where all revenue accrual is driven by performance obligation

Observations:
Since the majority of RevPro line is for 1-yr length, Revenue ~ ACV at revenue line level
There isn't much differences between Fixed term and Opt Out contracts
Revenue Lines of more than 400k are outliers that are worth further review as they are likely one-time special deals that might not be recurring annually
2. Contracted Hours vs TCV and contracted hour vs ACV


Observation:
Since the vast majority of RevPro line is 1-year long with some others being 1.5yr and 0.8yr but with ACV formula only annualize lines where length is at least 1 year, Revenue and RevLine (RL) ACV should behave exactly the same when used in analysis with other variables
The more Contracted Hours, the more Revenue it is in each RevPro line, which makes perfect business sense: company charges more money for more services hours
While there is a strong correlation between Contracted Hours and Revenue, there is almost no correlation between Contracted Hours and Hourly Revenue, which suggests that this firm keep the rate hourly rate flat regardless of total contracted hours.
Other business models might charge higher hourly rate for more total contracted hours if the complexity scales positively with workload.
Other business models might charge lower hourly rate for more total contracted hours if the fixed cost of making delivery is stable and that they can easily scale up services hours for clients without much incremental costs to the firm. In this case, firm can offer "discount rate" to clients for buying more hours.
2. contract level analysis
1. Contract Type analysis
Numbers of clients and contracts having Fixed Term type is more than 2x those with Opt Out type
Average Contract Length is roughly the same between 2 different kinds of Contract Type, around 2.8 yr
Average TCV for Opt Out is 17% HIGHER than Average TCV for Fixed Term
Average Contracted Hours for Opt Out is 31% HIGHER than Average Contracted Hours for Fixed Term
Revenue Recognized To Date progress at 46% for Fixed Term is higher than Opt Out at 42.5%
Actual Hours progress, measured as Actual Hours / Contracted Hours, is only 2/3 of Actual Revenue Recognized To Date, due to the impact of "use it or loose it" rule, which true up all revenue accrual at end date of each revenue line even when clients didn't use all contracted hours

2. Active contracts (which will generate future revenue) vs Past/Ended contracts


Observations:
"Active" contracts which haven't ended at the date of consideration have higher Average TCV, ACV, contract length, Contracted Hours than those ended. This indicates that overtime, this company is able to sign longer-term contracts of higher ACV values with clients. It signifies positive business growth.
The majority of "Active" contracts are Currently active (currently generating revenue). Future contracts are early renewals, or in some rare cases, early sale (contracts already signed and entered in system but Start Date is in the future).
Contracts that have ended have 100% of revenue recognized (Revenue = Recognized To Date) even though Actual Hours is only 67% of Contracted Hours. This confirmed the "use it or lose it" practice, which true up all revenue accrual at end date of each revenue line even when clients didn't use all contracted hours.
3. Contract Length Review


Observations:
Contract Length ranges from 1 month to almost 6 years
The majority of contract length is a rounding number of years: 1, 2, 3, 4, 5 with 3 years being the median and mode
Outliers on the lower ends (contracts of a few months length) should be looked into further to determine if they are recurring in nature, and hence should be counted in ARR calculation or not
Although histogram of Contract Length (years) for Fixed Term and Opt Out contracts look very similar, there are higher peaks at 1 and 3 yr, meaning that there are significantly more Fixed Term contracts of 1yr and 3yr length vs Opt Out contracts
4. Total Contract Value (TCV) Analysis


Observations:
Distribution is right-skewed by outliers on the upper end as the longer the contract, the more revenue company should charge clients
Mean TCV > Median TCV also confirmed the highly right-skewed distribution shape
There is only 1 promo/free deal which we can exclude from analysis going forward

This scatterplot confirms the logical guess that this company can and should charge more revenue for longer-term/multiyear deals
5. Annualized Contract Value (ACV) Analysis


Observation:
A few Contracts with ACV > 400k are 3-year and 1-year deals, which we should look into further to see if those contracts include special terms or add-on services
A handul of outliers on both upper and lower ends should be looked into, but they are not the drivers of skewness in TCV or ACV
Average ACV is 84k and Median ACV is 70k

This scatter plot shows a a very weak correlation between contract length and ACV (which is different from contract length and TCV picture above)
Correlation between 'Contract Length (years)' and 'ACV': 0.125
6. All Contract Value Metrics side-by-side

Observation: We should separate outlier contracts into their own bucket to investigate their specific details and figure out how the company can charge significantly more for those clients and contracts
7. contract cohort analysis: number of contracts and acv

Observation:
Overtime, ACV generally increases but seems to be capped at slightly under $100k
There are some outlier deals between 2018 Q1 and 2019 Q1 that drive ACV significantly up in those early quarters
2021 Q1 recorded the most number of contracts but they seem to be given discounts that make ACV lower than 2020 Q4
8. contract cohort analysis: contracted hours and actual hours and hourly revenue

Observation:
Total Contracted Hours peaked in 2021 Q1, the same pattern as total number of contracts
Most contracts don't use up all of Contracted Hours (Actual Hours is always a fraction of Contracted Hours)
Average Hourly Rev is generally capped under /$180, with an exception of 1 special contract in 2023 Q3
Average Hourly Rev did trend up between 2019 Q4 and 2021 Q3
3. Client level analysis
Past vs Current clients review

Observations:
The vast majority of clients continue to do business with this firm
For clients that continue to buy services, the firm is able to sell longer-term contracts at higher annualized revenue values
Yet, given that average revenue per hour only increases slightly, the higher revenue is mostly driven by selling more contracted hours, not by increaseing hourly rate, which is something we should look into
2. Distribution of Contracted Hours and Hourly Revenue by Active Clients

Client 3 is an obvious single outlier with Total Contracted Hours being 3x higher than the next client
There are some outlier clients signing up for enormous number of hours, causing the histogram of Contracted Hours by Client to be extremely right-skewed. We should look at them separately


2. Pareto Analysis with ACV - Active contracts

The top 20% Active clients (105 clients) account for roughly 50% of ACV that this company has sold
The top 55% Active clients (290 clients) account for rouhgly 80% of ACV that this company has sols
3. CLIENT cohort analysis - ARR

Steady growth from 1M to 40M ARR from FY2017 to FY2022