
Welcome to my step-by-step guide on mastering key SaaS revenue metrics: Annual Recurring Revenue (ARR), Retention Rate (and Churn Rate), and Revenue Accrual!
The main focus of this blog post is to illustrate all the data processing and calculation steps needed to arrive at these critical top-line metrics for a subscription-based business using contract data. By looking at specific examples, we will differentiate between ARR and Revenue Accrual, shedding light on how the 2 concepts, while related, are not the same. Depending on specific ASC 606 rules being applied, they don’t even necessarily converge or grow at the same rate YoY. For ease of understanding, we assume revenue for all contracts in this dataset can be prorated from Start to End dates (equal daily dollars).
When we need to evaluate a SaaS start-up for acquisition, these steps are essentially the Due Diligence tasks to access the trend, strength, and run-rate potentials of the firm.
Link to Excel file (with data and formulas) on my Github repository:
https://github.com/ExcellentBee/Excel-Calculate-ARR-Retention-Revenue-Accrual-from-Contract-Data
Link to Python codes on my Github repository:
https://github.com/ExcellentBee/ARR-Calculation-Saas-Contracts-Due-Diligence/blob/main/ARR%20Calculation%20-%20SaaS%20Contract%20Due%20Diligence.ipynb
Perform EDA (Explorotary data analysis) of contract data
The raw dataset we get is in tab “Historical Contract Data”. It’s a pretty simple data table with 11 columns and 1488 rows.
“Invoice Number” is the unique ID, each row contains a unique contract with different start date, end date, and invoice amount for different clients
Each client can have one or multiple contracts: some contracts overlapping in timeline while others cover completely different periods
There could be up to 4 products being bundled in a contract
The earliest start date is in Jan 2018 and the latest end date is in July 2025, meaning that this dataset contains contracts from the very first year of operation for this hypothetical firm and contracts can run multiple years into the future
When we look at the earliest start date by Customer ID to perform cohort analysis, we see that the last cohort start date is in Q2 2022. Assuming that this is latest and greatest dataset of all available contracts, we can tell that the time when this snapshot was taken is towards the end of H1 2022
1. Let’s look at Contract Length distribution


Contract length ranges from 1 to 48 months
Most contracts are in one of 5 term categories ranging from 1 to 3 year in 0.5 year step: 1-year, 1.5-year, 2-year, 2.5-year, 3-year
Contract length seems to follow a uniform distribution
Outliers where contracts last only 1-2 months need to be investigated
2. Let’s look at TOTAL contract value (TCV) distribution


TCV ranges from $0 to $600,000. Excluding contracts with $0, TCV ranges from $1,400 to $600,000
There could be 2 reasons why contracts with $0 show up here:
They are voided contracts, meaning that they should not be included in this analysis
They are fully-discounted contracts where service is offered to clients at no cost, normally done as Proof of Concept (POC) or special promo deal contracts, in which case we should keep these contracts in the data population for accurate client count calculation
Median TCV of around $20k < Mean TCV of $32.5k confirms the right-skewed distribution we see in histogram. This means that there are some outsized deals on the upper end
3. Let’s look at ANNUALIZED contract value (ACV) distribution


ACV ranges from $0 to $600,000. Excluding those with $0, ACV ranges from $933 to $600,000
Median ACV of around $10.5k < Mean ACV of $17k confirms the right-skewed distribution we see in histogram. This means that there are some outsized deals on the upper end
Max ACV is around 57x the Median ACV (600k vs 10.5k)
4. Let’s look at Daily contract value (DCV) distribution


Daily Amount ranges from $0 to $5,435. Excluding those with $0, Daily Amount ranges from $2.55 to $5,435, indicating that different clients are being charged different daily rate
Max DCV is around 188x the Median DCV ($5,435 vs $28.8) which is more than 3 times the stat for ACV, indicating the even more right-skewed shape and existence of extreme outliers in DCV range
5. Let’s look at ALL contract value Metrics Side-by-Side

This dataset clearly has outliers in both Contract Length and ACV that need to be reviewed further. Including outliers that are not truly recurring annually could severly impact the accuracy of ARR calculation.
6. Scatterplot of contract value vs contract length


The 2 scatter plots mimic each other and clearly show that there are a handful of short-term contracts with enormous Invoice Amount/TCV that cause the histogram of TCV, ACV, and DCV to be right skewed
Upon closer investigation, it's pretty clear that these are not annually recurring contracts and thus need to be excluded from ARR calculation
7. Pareto analysis: Does 80% of TCV comes from top 20% clients?

The top 20% clients (by TCV) accounts for around 58% of TCV that this company has sold
The top 40% client (by TCV) accounts for around 80% of TCV that this company has sold
But we know that there are a lot of one-time, short-term, gigantic deals being included here. So … Let’s take a look at non-outlier deals that are qualified for ARR calculation only

The result for ARR-qualified deals ONLY is pretty much identical to the full population picture, with top 40% clients (around 140 clients) accounting for 80% of TCV that this company has sold
2. Special notes about calculating arr & mistakes to avoid
1. Identify outliers to exclude one-time revenue
Using charts in EDA step above is specially helpful to quickly identify outliers that are NOT truly recurring in nature to be excluded from our ARR calculation.
Question: BUT, by definition, subscription products mean recurring revenue right? Why do we need to identify non-recurring items?
Answer: YES, companies often report revenue for subscription products separate from other revenue streams like maintenance, setup implementation, professional services, consulting services, etc. HOWEVER, just because the product itself is subscription-based doesn’t mean that 100% of contracts including this product is recurring. There will always be special cases where clients want customized deals that only cover a short period of time.
In our dataset, there are at least 6 rows where contract length is less than 1 year but contract value is “through the roof”, these are customized deals to fit specific clients’ needs, like short-term campaigns. They help boost short-term revenue accrual for this firm, but because they are not-recurring in nature, they should be excluded from ARR calculation. A consultation with sale team to inquire about the nature of these deals could be super helpful to validate the decision.

For our analysis here, we (manually) mark these cases as “Exclude” so that we don’t factor them into ARR calculation
2. don’t annualize less-than-12-month DEals if not confirmed to be recurring rev
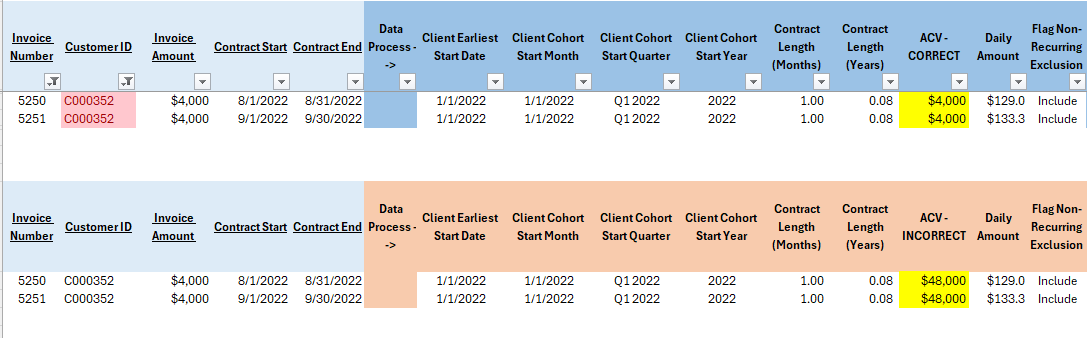
One of the biggest mistakes I often see in ARR calculation task is annualization of short-term deals that are not repeatable on an annual basis. The danger of dividing by a fraction of 1 year (1/12 for monthly or 1/4 for quarterly) is that Contract Value will be magnified by a factor of 12 or 4 respectively, thus, inflating ARR significantly if they turn out to be NOT monthly-recurring or quarterly-recurring deals.
In our dataset, here are examples of 1-month deals that don’t truly recur annually. If we naively take $4,000/(1/12) = $48,000 then ARR will be over-inflated by 48k - 4k = 44k. It’s worth checking in with sales team to confirm the nature of deals like these. They can either be excluded from ARR calculation OR only their original CV should be included, not the blown-up annualized amount.
3. Calculate arr as of a specific date, not a date range
Contract can renew at any random date within the month, ARR calculation should only count ARR for contracts that are Active as of a specific date. Otherwise, ARR from both old/ending contract and new/renewing contract will be duplicated.

3. summarize arr waterfall from contract level to client level
Summing ARR at end date of 2018, 2019, 2020, 2021 and H1 2022 for each Customer ID and order by Client Cohort Group is easily done with a pivot table. Then we add in categorizations of “New Logo”, “Upgrade” (which includes flat price), “Downgrade”, “Drop Client Recapture”, “Churn” based on comparison of ARR values between consecutive years.
For example, client C000005 joined in 2018 for $12.5k of ARR. ARR stays the same in 2019, but for convenience, anything that doesn’t go down in dollar value is grouped together with “Upgrade”. Then ARR dropped to $0 in 2020, meaning “Churn”. They came back in 2021, which means “Drop Client Recapture”. Then in 2022, ARR goes down from $15k in 2021 to $6.25k, which is a “Downgrade”.

Now we have all building blocks we need to summarize key revenue metrics for all historical periods
4. summarize client count and arr changes throughout the years
1. ARR Balances: It’s simply addition and subtraction at this point

2. RETENTION RATEs, net and gross: Calculate as a % of beginning arr balance

3. client count balance throughout years

5. calculate revenue accrual by prorating cv from start to end date
Revenue Accrual is done in tab “Contracts Revenue Accrual” which simply spread revenue evenly each day from start date to end date (inclusive). Result is summarized into Recurring and Non-Recurring subgroups.
Comparing ARR (Ending Balance) with Revenue Accrual, we can see that Revenue Accrual lags behind, this is from day 1 of a contract, we can count full Annualized Contract Values in the ARR bucket, yet only one day worth of CV is recorded as Revenue Accrual.
Revenue Accrual is a summary of each and every month within a period while ARR is calculated using one specific date, normally the last date of a period.
